South Africa GDP Q1 2026: Growth Holds, But Investment Weakness Matters
South Africa
GDP
Macro-Financial Analysis
Policy
Investment
A Linkage Analytics macro-financial note on South Africa’s Q1 2026 GDP release.
Executive Summary
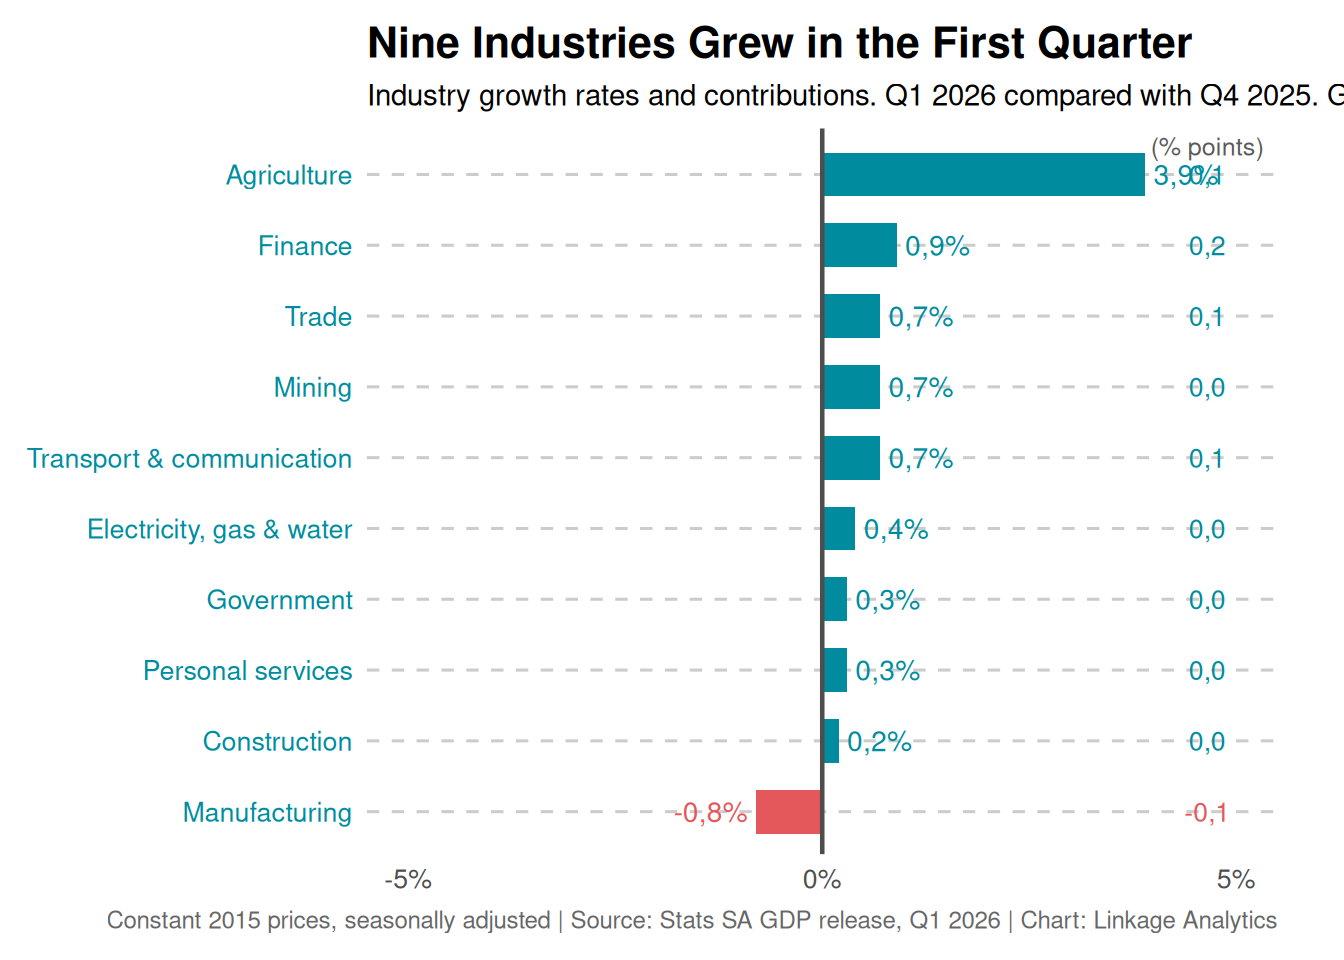
South Africa’s economy expanded by 0.5% quarter-on-quarter in Q1 2026, marking a sixth consecutive quarter of growth. The result points to continued positive momentum, with finance, agriculture, trade, transport, and mining supporting activity on the production side.
However, the headline number should be interpreted with caution. The growth profile remains uneven. Manufacturing contracted, capital formation declined, and household consumption increased only marginally. For investors and policy-makers, the key message is that South Africa is still growing, but the quality of growth remains dependent on services, agriculture, external demand, and financial-sector resilience rather than broad-based productive investment.
Key Macro-Financial Takeaways
| Theme | Signal | Interpretation |
|---|---|---|
| Real GDP growth | 0.5% QoQ | Positive growth momentum continued |
| Annual GDP growth | 1.9% YoY | Economy expanded stronger than expected |
| Finance sector | 0.9% | Main production-side contributor |
| Agriculture | 3.9% | Strongest industry growth rate |
| Manufacturing | -0.8% | Second consecutive quarterly decline |
| Capital formation | -1.1% | Weak investment signal |
| Household consumption | 0.1% | Consumer demand remains fragile |
| Exports | 0.5% | Supported by minerals, fruit, and beverages |
| Imports | -2.6% | Helped expenditure-side GDP mechanically |
Production-Side GDP: Services and Agriculture Carried Growth
The production-side data show that nine industries expanded, while manufacturing was the only major sector to contract. Agriculture recorded the strongest growth rate at 3.9%, while finance added the largest contribution to headline GDP growth.
For investors, this matters because the growth pattern favours sectors linked to financial services, agriculture exports, logistics, and selective mining activity. However, the contraction in manufacturing suggests that industrial momentum remains weak, which limits the breadth and durability of the recovery.
Expenditure-Side GDP: Growth Was Supported by Lower Imports
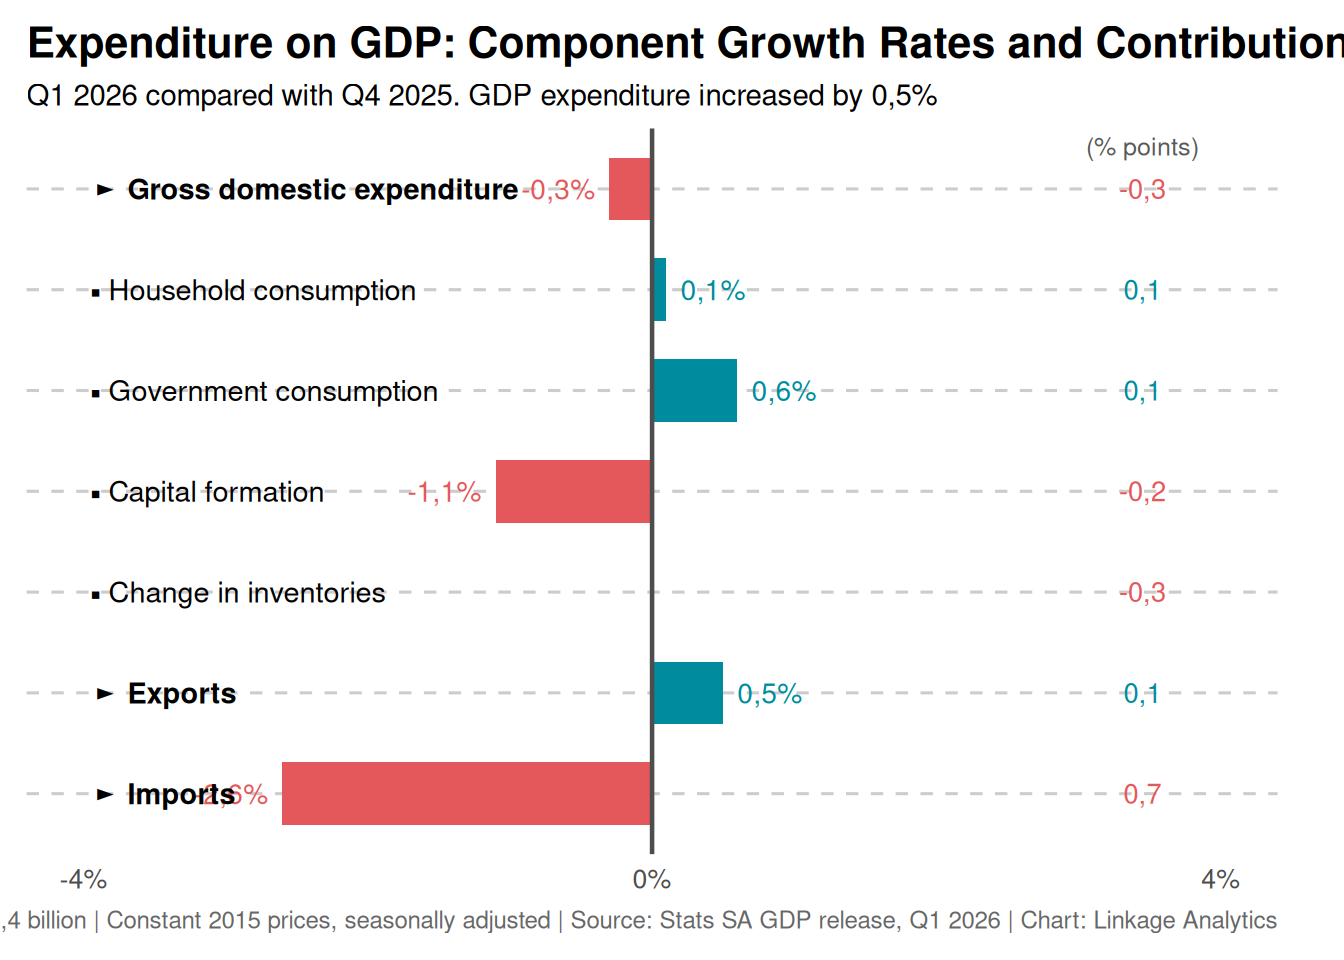
The expenditure-side picture is more mixed. Household consumption rose by only 0.1%, while capital formation fell by 1.1%. Imports declined by 2.6%, which provided a positive contribution to GDP from an accounting perspective.
This is important because GDP can improve when imports fall, but weaker imports may also reflect softer domestic demand, weaker investment, or reduced import-intensive production. Investors should therefore avoid reading the headline GDP beat as a full signal of domestic demand strength.
Household Consumption: Consumer Spending Remains Fragile
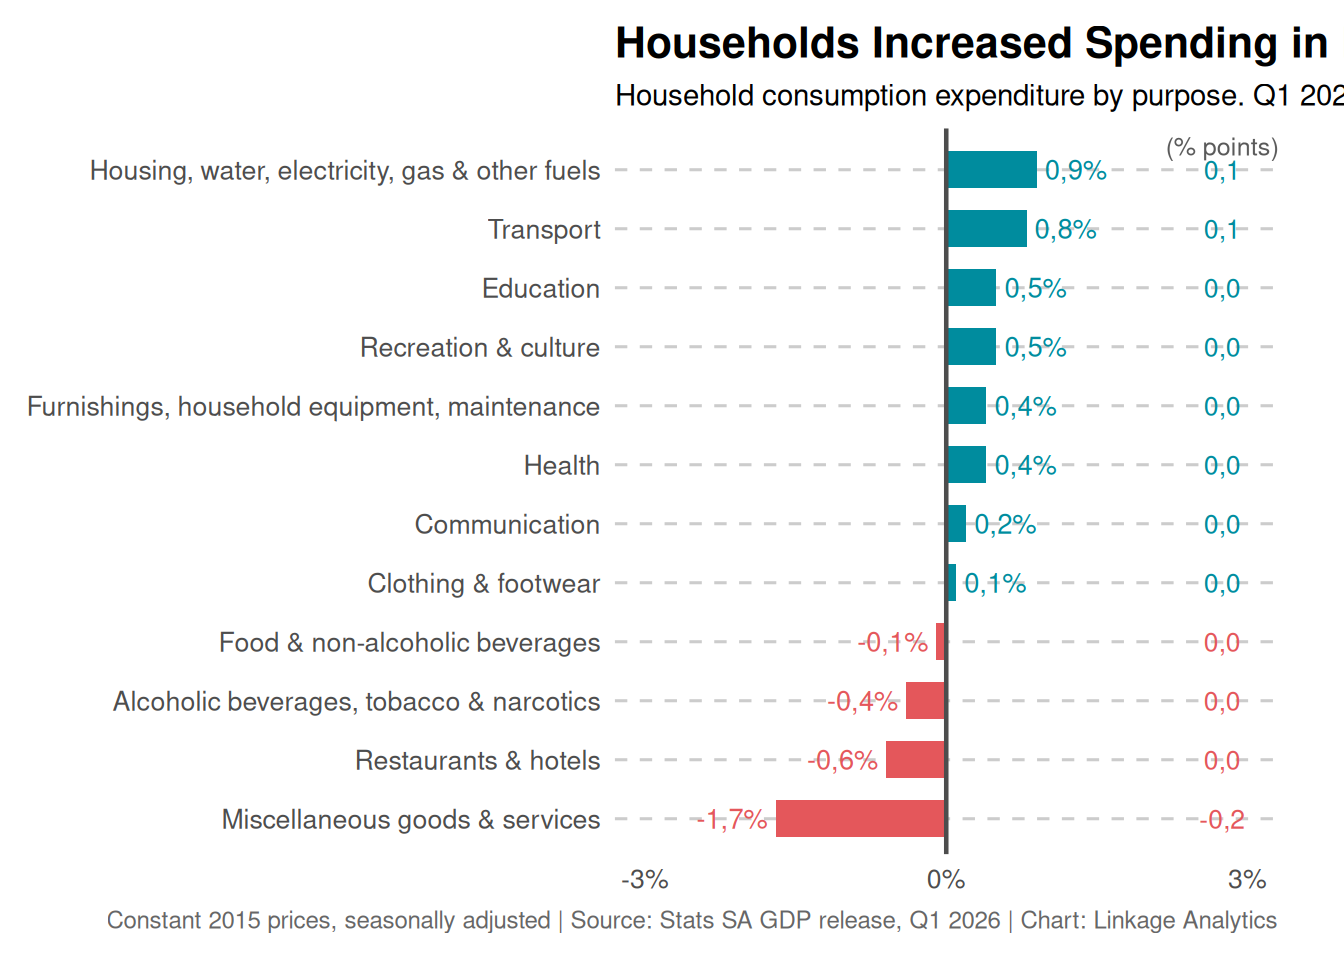
Household spending increased in eight product categories, but the overall rise in household consumption was only 0.1%. Spending on housing-related utilities and transport supported growth, while restaurants and hotels, food and non-alcoholic beverages, and miscellaneous goods and services were weaker.
This suggests that the consumer environment remains fragile. For equity investors, this points to a cautious reading of consumer-facing sectors. The data do not yet indicate a broad-based consumer recovery.
Investor Implications
The Q1 2026 GDP print is constructive, but not uniformly strong.
For equity investors, the data support a more selective sector view. Financials, agriculture-linked businesses, logistics, selected mining exposures, and export-linked companies may benefit from the current growth mix. Consumer-facing and manufacturing-linked sectors remain more exposed to weak demand, cost pressure, and uneven production conditions.
For fixed income investors, the GDP beat may reduce near-term growth concerns, but weak capital formation and subdued household consumption suggest that the recovery is not overheating. This keeps attention on inflation, fiscal risk, debt-service costs, and the SARB policy path.
For currency markets, stronger GDP and export support are positive for sentiment, but the rand will remain sensitive to global risk appetite, commodity prices, fiscal credibility, and interest-rate differentials.
Policy Implications
For policy-makers, the key issue is not only whether GDP is growing, but whether growth is broad-based, investment-led, and employment-supporting.
The decline in capital formation is a concern because sustained growth requires stronger investment in machinery, infrastructure, residential building, logistics, energy, and productive capacity. Manufacturing weakness also remains important because it affects industrial depth, exports, employment, and supply-chain resilience.
The policy priority should therefore remain focused on:
strengthening investment conditions; improving infrastructure and logistics performance; supporting energy reliability; reducing policy uncertainty; improving industrial competitiveness; supporting export capacity; and building confidence for private-sector investment. Linkage Analytics View
The Q1 2026 GDP release shows that South Africa’s economy is still moving forward, but the underlying growth profile remains uneven. The combination of stronger finance, agriculture, trade, and exports is encouraging. However, weak manufacturing, soft household consumption, and falling capital formation point to an economy that is growing, but not yet transforming into a stronger investment-led expansion.
For investors and policy-makers, the signal is clear: the headline GDP beat is positive, but the quality, breadth, and sustainability of growth matter more.
Sources Stats SA GDP release, Q1 2026 Stats SA GDP media presentation and Excel data Linkage Analytics calculations and charts based on published Stats SA figures
Disclaimer
This publication is provided for general information, research, and educational purposes only. It does not constitute financial advice, investment advice, trading advice, legal advice, tax advice, or a recommendation to buy, sell, or hold any security, financial instrument, currency, commodity, or investment product.
Although reasonable care has been taken to ensure that the information and analysis are accurate at the time of publication, Linkage Analytics and the author make no guarantee regarding the completeness, accuracy, or timeliness of the information. Market conditions may change rapidly.
Readers should not rely solely on this publication when making investment, policy, or strategic decisions. Independent professional advice should be sought where appropriate.
Source: Statistics South Africa and Linkage Analytics analysis.
```